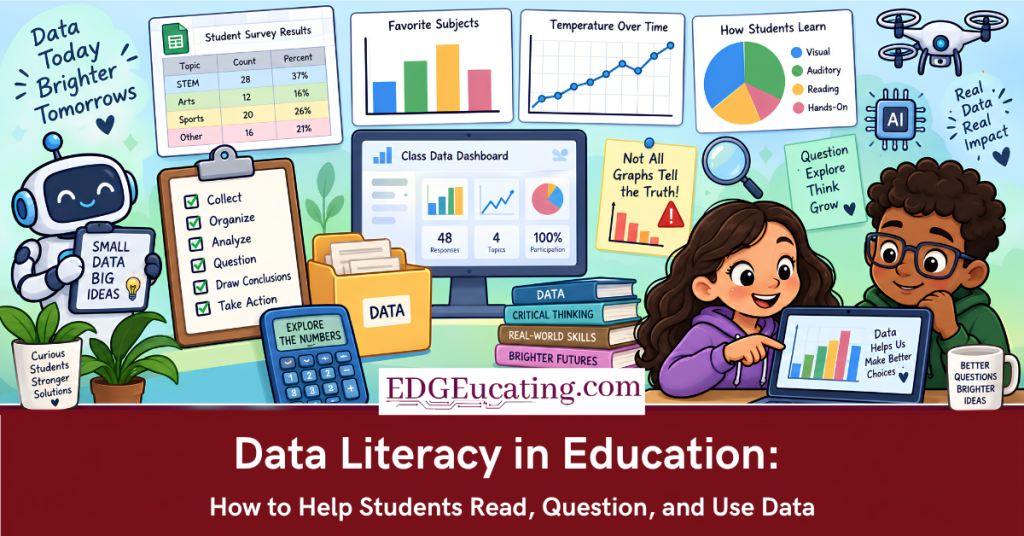
Your students can probably make a bar graph. But can they tell when one is trying to fool them?
Can they look at a statistic on social media and ask where the number came from? Can they collect information, identify a pattern, and use evidence to defend a conclusion?
Those skills are part of data literacy, and they are quickly becoming as important as traditional reading, writing, and math.
In a world increasingly shaped by artificial intelligence, algorithms, dashboards, polls, statistics, and visualizations, helping students understand data isn’t simply preparation for a future career.
It’s preparation for everyday life!
What Is Data Literacy for Students?
At its simplest, data literacy is the ability to read, work with, analyze, question, and communicate with data.
For students, that means moving beyond memorizing formulas or creating a graph because the worksheet says to. They need opportunities to interpret information, recognize patterns, notice outliers, evaluate sources, and decide whether the evidence actually supports a conclusion.
A second grader might record plant growth. A middle school student could compare local weather patterns. A high school history class might analyze population changes.
The most important question isn’t always, “Did you calculate the right answer?”
It’s:
What does this data actually tell us—and what doesn’t it tell us?
That small shift creates much deeper learning.
The Data Literacy Problem Isn’t New
We talk a lot about preparing students for a “data-driven future,” but the challenge didn’t suddenly appear with ChatGPT or Claude.
Data analysis, statistics, and probability have been part of national mathematics assessments for decades, yet student performance in these areas has been concerning for decades.
Between 2019 and 2022, scores in the data analysis, statistics, and probability portion of NAEP mathematics fell 10 points for eighth graders and four points for fourth graders. Researchers found that decline was actually part of a longer trend: over roughly the previous decade, scores had fallen 17 points for eighth graders and 10 points for fourth graders.
And the broader math picture remains challenging. In the 2024 NAEP results, only 61 percent of eighth graders performed at or above NAEP Basic in mathematics, meaning 39 percent scored below that level. NAEP also cautions that its achievement levels should not be interpreted as the same thing as state-defined grade-level proficiency.
So while our world has become dramatically more data-driven, many students still need much more experience making sense of that data.
That’s something we can change.
Why Data Literacy Matters Even More in the Age of AI
Here’s the connection educators can’t afford to overlook:
Data is foundational to artificial intelligence!
AI systems learn patterns from data. That means students who don’t understand how data is collected, selected, organized, represented, and potentially biased will have a much harder time evaluating the information AI gives them.
Instead of only teaching students how to use AI, we need them asking questions like: Where did this information come from? What might be missing? Could this dataset contain bias? What evidence supports this answer? What should I verify?
That is why data literacy, AI literacy, media literacy, and computational thinking increasingly overlap. In fact, computational thinking asks students to logically organize and analyze data, recognize patterns, create models, and use information to solve problems. If you want to explore that connection further, read Computational Thinking: NOT Just Another “Buzzword!”.
Preparing students for AI shouldn’t begin with prompt writing.
Once students begin understanding that connection between data and AI, educators can take the next step by letting them explore how AI actually works. In Teaching AI Made Easy: How to Safely Introduce Artificial Intelligence in Your Classroom, we look at practical ways teachers can introduce concepts such as computer vision, machine learning, and AI through hands-on classroom experiences.
Preparing students for AI should begin with teaching them how to think critically about information. This is how we should begin putting AI in every classroom in a realistic and meaningful way!
How Can Teachers Build Data Literacy in the Classroom?
The good news is that data literacy doesn’t have to become one more subject squeezed into an already full schedule.
It works best when it becomes part of what students are already learning.
Start With a Real Problem, Not a Spreadsheet
Instead of beginning with, “Today we’re learning how to make a graph,” begin with a problem students want to solve.
Which area of our school produces the most waste? Does temperature affect plant growth? How does soil moisture change throughout the day? Which robot design completes a challenge most efficiently? Which drone flight path reaches the target fastest?
Now students have a reason to collect data.
That’s where inquiry-based learning, STEM, and STEAM become especially powerful. Students aren’t manipulating numbers because the textbook told them to. They need the information to make a decision, test an idea, or improve a solution.
Let Students Collect Their Own Data
Some of the best datasets never need to come from a textbook.
Students can measure temperature, distance, light, sound, soil moisture, acceleration, flight time, plant growth, robotics performance, or dozens of other variables.
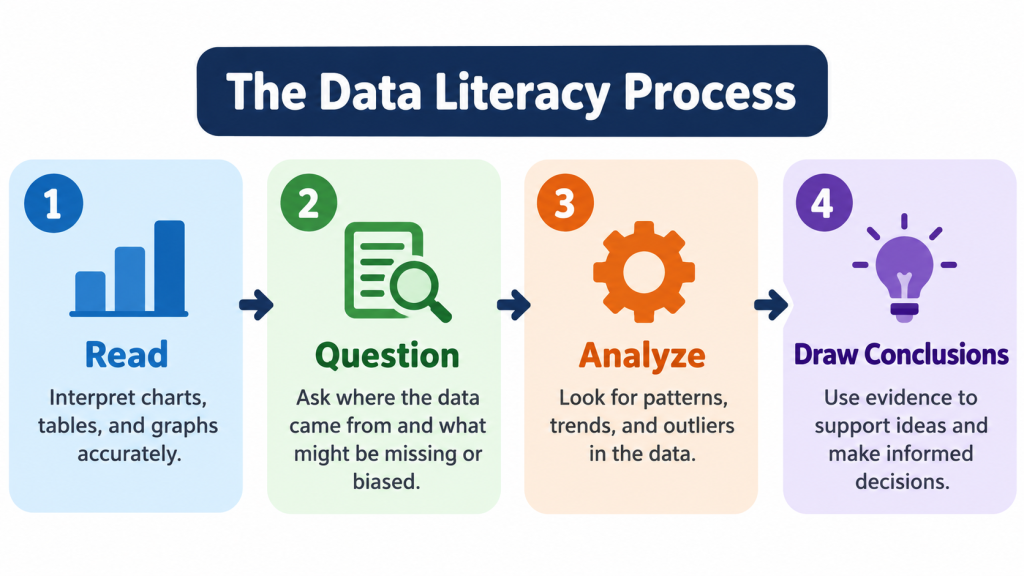
Then take them through the complete process: collect the data, organize it, visualize it, identify patterns, discuss anomalies, and decide what conclusions the evidence supports.
Robotics can make this process especially engaging because students can gather observations, test a program or design, evaluate the results, and revise their approach. Our Empower Young Scientists: Teaching Computational Thinking with VinciBot lesson shows what this kind of hands-on computational thinking can look like inside a science investigation.
Suddenly, mean, median, percentages, graphs, and spreadsheets have a purpose!
Make Graphs a Mystery
Try removing the title or labels from a graph before showing it to students.
Ask: What do you notice? What might this represent? What patterns are visible? What information would you need before drawing a conclusion?
Then take it further with misleading graphs. Change an axis, remove context, manipulate a map scale, or show only part of a timeline.
Students quickly discover that a professional-looking graph isn’t automatically a trustworthy one.
That’s data literacy meeting media literacy—and our students need both.
Put EdTech to Work Collecting Real Data
This is one area where educational technology can move students beyond worksheets and into authentic investigation. The goal isn’t to use technology simply because it’s exciting. It’s to give students something meaningful to measure, compare, question, and improve.
Labdisc is probably one of the clearest examples. Its built-in science sensors allow students to collect real-time measurements and analyze them using data-analysis software. A class might measure temperature, light, humidity, pH, or other variables, then graph changes and investigate why an outlier occurred. Depending on the model, Labdisc provides multiple integrated sensors in one portable data-logging system.
Forward Education’s Climate Action Kit brings that same thinking into environmental problem-solving. Students can use sensors such as moisture, solar, sonar, and infrared sensors while developing projects around issues like smart agriculture or renewable energy. Instead of discussing sustainability only in theory, students can gather evidence and use it to improve a prototype.
KaiLab, formerly Kai’s Clan, can turn robotics into a data investigation through its IoT sensors. Students can collect live information such as soil moisture or environmental measurements, visualize the results, and export data for further analysis. Imagine teams creating a smart garden, comparing moisture readings, and programming a response based on the evidence they collect. Not to mention the Augmented Reality (AR) and Virtual Reality (VR) aspects of this product really amp up student engagement!
Robotics and AI tools offer another entry point. With Matatalab Nous AI, students can explore how data connects directly to artificial intelligence by collecting information, training AI models, and testing applications such as image recognition or autonomous navigation. Students begin to see that an AI system’s results depend on the information used to train and guide it.
This doesn’t have to be an abstract computer science lesson, either. In From Dichotomous Keys to AI: A Modern Guide to Teaching Plant Classification in STEM Education, students move from traditional plant classification to training an AI model to recognize patterns and classify organisms. It’s a great example of how science, data literacy, computational thinking, and AI can come together around one real-world investigation.
With pi-top, students can build sensor-based robotics and physical computing projects, giving them opportunities to collect measurements and use those results inside a larger engineering challenge. A simple environmental monitor, for example, can lead students from coding a sensor to analyzing changes and deciding what those changes mean.
Maker & Coder’s MC4.0 can extend this thinking into AI, robotics, and IoT. Its AIoT options include environmental sensors and an AI camera, while compatible IoT platforms can allow students to gather and analyze real-time information. That opens the door to projects where students aren’t simply programming a robot—they’re using environmental data to decide what the robot should do.
Even engineering tools such as Lectec can become data-literacy platforms. Students can test real mechanical systems, collect measurable outputs, and create comparisons such as speed-versus-torque graphs. Now concepts like efficiency, acceleration, and energy loss become something students can investigate rather than simply read about.
And Don’t Forget Drones
Drones create another surprisingly rich opportunity for data literacy because flight produces information students can see, measure, and act upon.
CoDrone EDU, for example, includes programmable sensors for acceleration, rotation, pressure, distance, color, and position. Students can retrieve sensor values, compare results across flights, and use that evidence to revise their code.
With Firia Labs CodeAIR, students can use Python to read sensors and program autonomous flights involving navigation, computer vision, and machine learning. A mission can become a genuine investigation: collect sensor data, determine why the drone missed a target, adjust the program, and test again.
And Tello drones paired with Drone Legends can make data part of mission-based STEM learning. Students can record flight times, distances, accuracy, or successful attempts and compare which strategy worked best during real-world-inspired challenges. Drone Legends combines Tello flight, coding, teamwork, and problem-based missions rather than treating the drone as something students simply fly for fun.
That’s the important connection across all of these tools.
Technology gives students data.
Good teaching gets them to question it!
Take Data Beyond Math Class
Data belongs everywhere.
Social studies students can investigate census and demographic information. Science students can study ecosystems, weather, energy, and experiments. ELA students can examine statistics used in articles and determine whether they actually support an author’s argument.
Students can even analyze their own learning data, looking for patterns in assessment results or common mistakes and setting evidence-based goals.
When we leave data entirely inside the math classroom, students can miss one of the most important lessons:
Data always has context.
Teachers Need Data and AI Professional Development, Too
We can’t expect teachers to confidently teach data literacy and AI literacy without opportunities to build those skills themselves.
Professional development around AI should go beyond demonstrations of the newest generative AI tool.
Teachers need time to investigate datasets, work with sensors, evaluate AI outputs, create real-world projects, explore ethical questions, and see how data, AI, STEM, and computational thinking connect to standards they’re already responsible for teaching.
That is also where hands-on professional development matters. Teachers should experience the same inquiry cycle we want for students: ask a question, collect information, find patterns, test an idea, make a change, and try again.
Data Literacy Is Really About Learning to Think
Ultimately, we aren’t trying to turn every student into a data scientist.
We’re trying to develop students who see a statistic and ask where it came from. Students who don’t automatically trust a colorful graph because it looks official. Students who can collect evidence, recognize patterns, challenge assumptions, and explain why the evidence supports—or doesn’t support—a conclusion.
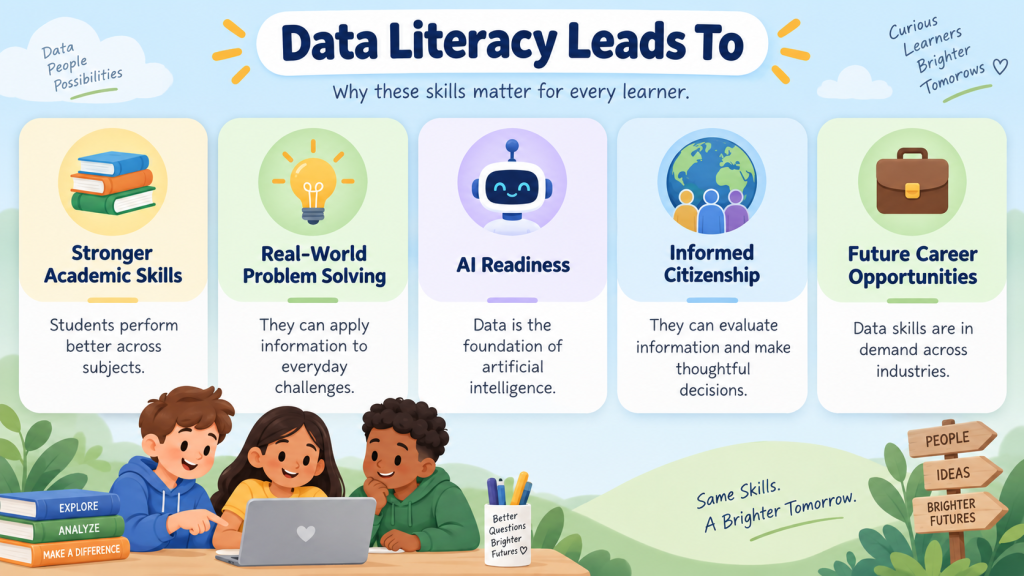
Those abilities connect data literacy with computational thinking, critical thinking, media literacy, AI literacy, and responsible citizenship.
And as AI becomes increasingly integrated into how we learn, work, communicate, and make decisions, those connections will only become more important.
If we want students to leave our classrooms ready to participate productively in an AI- and data-driven world, we can’t only teach them how to find answers.
We need to teach them how to question
the data behind those answers.
Ready to Take Data Literacy Further?
Data literacy doesn’t need to become another isolated initiative. It can grow naturally through the STEM, STEAM, AI, robotics, computational thinking, and project-based learning experiences you’re already creating. The goal is to give students more opportunities to ask questions, gather evidence, recognize patterns, and make decisions based on what the data actually tells them.